
At the Nebraska Children and Families Foundation, we monitor 8 risk and well-being indicators across the state to assess the overall condition of children in each county. This is one of the ways we determine which communities have the greatest need of funding, coordination and program consulting. The indicators we look at are:
-
Juvenile arrests
-
Poverty
-
Graduation rate
-
Infant deaths
-
Number of state wards
-
Child abuse and neglect
-
Births to teen parents
-
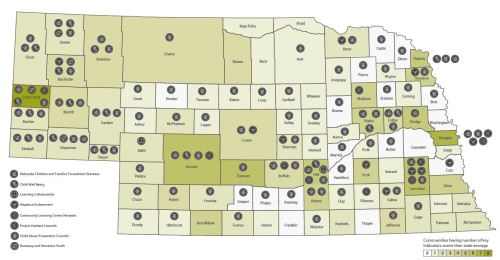
English as a second language
According to our latest data, here’s what Nebraska looks like. The darker the county, the more risk indicators are present.
When we compare Nebraska’s performance in these indicators to national averages, we get a clear picture of the areas where we’re making progress as a state, and where we need to focus more attention.
The chart below compares the national data and the Nebraska data from the most recently available year – 2011.

As you can see, Nebraska is dead even with the U.S. averages on important statistics like the infant death rate (6 per 1,000) and percentage of births to teens. Our state has fewer substantiated abuse and neglect cases than are seen nationwide, fewer of our children are living below the poverty level, and English as a second language – which is only a risk because of the social isolation and lack of access to services that can come with it – is less of a risk factor across the state.
Areas for improvement
The juvenile arrest rate in Nebraska is nearly twice the national average. While 15 children per 1,000 are arrested nationwide, 29 Nebraskan children per 1,000 are being arrested.
The same is true for children in foster care. Nebraska is removing children from their homes at twice the rate of the rest of the country (10 per 1,000 vs. 5 per 1,000). This fact is particularly interesting when noting that Nebraska’s overall child abuse/neglect rate is lower than the national average, but approximately 79% of children are removed from home due to neglect.
Top of the class
A particular bright spot is our state’s high school graduation rate of 86% in 2011. Compared to the national average of approximately 75%, our students are significantly more likely to have that critical diploma – often a major difference maker for young people who have other risk factors working against them.

No judgement, just data.
Facts are facts, and nothing more. These facts shine an interesting light on where Nebraska does well, and where we need to figure out some new solutions. Fortunately, we know that the Children’s Division of DHHS, the Children’s Commission, the Department of Education, the Nebraska Office of Juvenile Services, private service providers and many, many more committed partners are working on system-level ways to change some of these numbers.
Nebraska Children’s mission is to create positive change for Nebraska’s children through community engagement.

Leave a comment